Manual of Connecta
Belo Horizonte – Brazil - 2015
Features of Connecta
New
Review
A new analysis will scan on the
bytecode of a
Java program by
finding its components, for thereby calculate the
values of their metrics.
Click File -> New Analysis
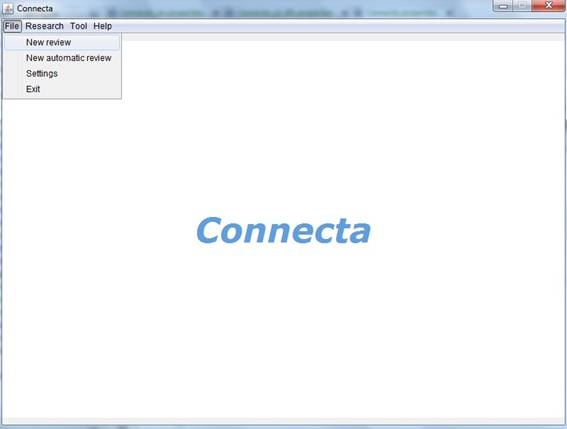
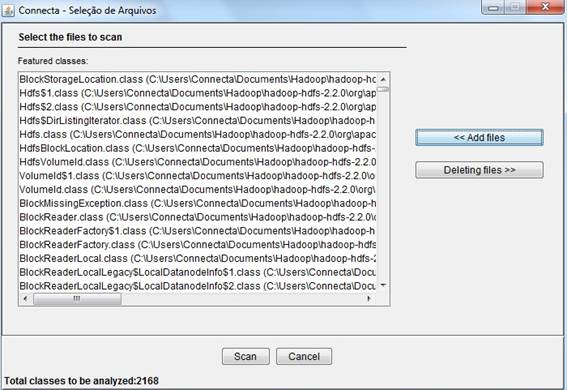
Then, click in Add Files -> In the dialog box,
select the directory of the bytecode file system
-> Click Scan


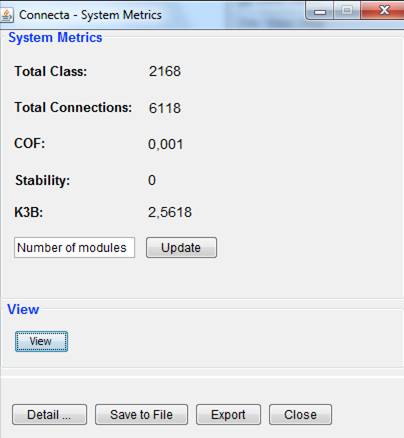
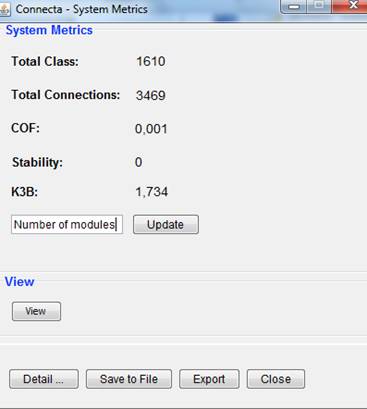
A window
will be opened with all the metrics system calculated, as follows.

To view the details of the system, simply
click on Details.
When selecting a class it is
possible to view details by clicking
Class Details, as following illustration:

To visualize the connection details,
simply select a connection and click in
the button Connection Details and, then,
a window will open
with all the details of the selected connection.


Returning the screen with system metrics, we can also save the file or
export your data, by clicking the
Save to File and Export button, respectively.
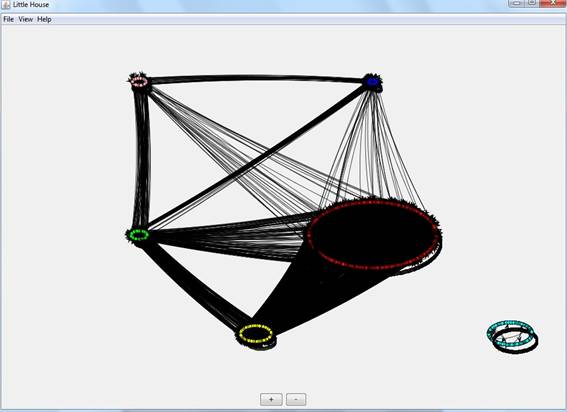
It is also possible to visualize
the model Little House
clicking the View button.
When selecting View
the software will be disposed macroscopic way, as the
following figure:
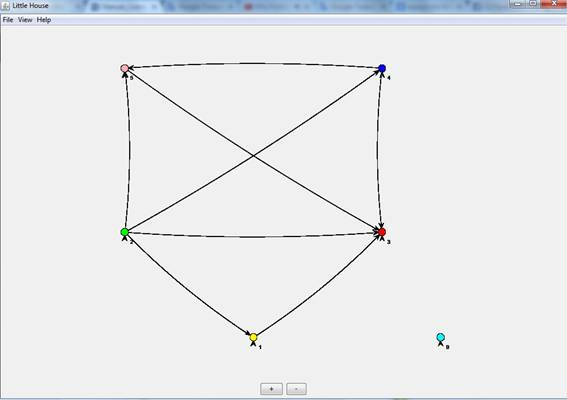
There are several options to change the model
visualization and interaction
with it. We can visualize each class separately, by clicking: View -> Layout -> Circular, so the system will have the shape of the figure below.
You can change the label that accompanies
each class, you can use the class ID,
her name or Little
House component that
is.
To this must go View -> Label and perform the desired choice. The interaction with the figure can also be adjusted by the Picking mode,
which allows you to select a number of classes and
change their position in the
figure, the Transforming mode can frame the view
of the way that best suits you, this option is set to View -> Mode.
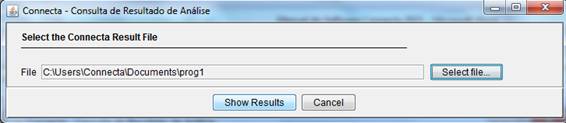
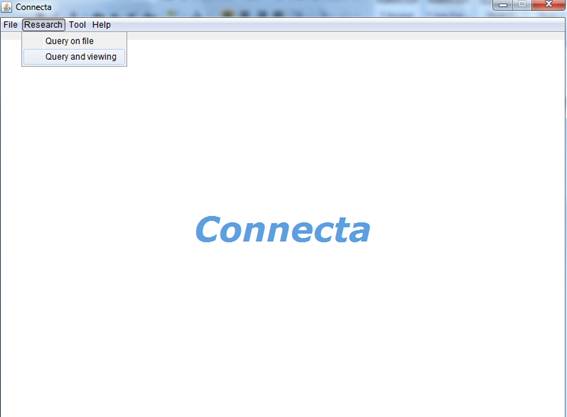
Query on file
The query on file show the results of an analysis previously performed
through without extension file that is obtained by the New analysis.
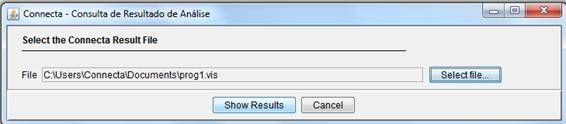
To do this, click Research -> Query on file -> Select
File. Select the file with no
extension and click Show Results.


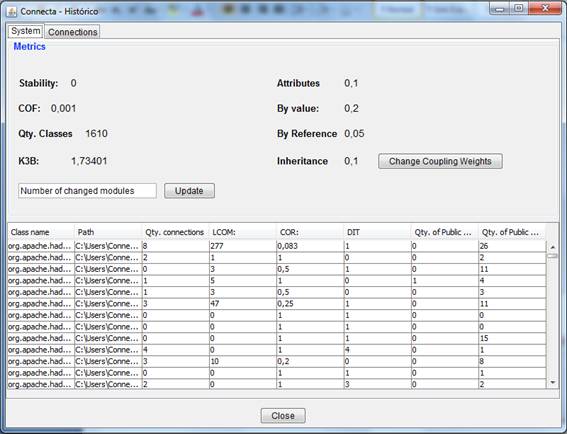
The system results will be arranged
on the screen, as follows.
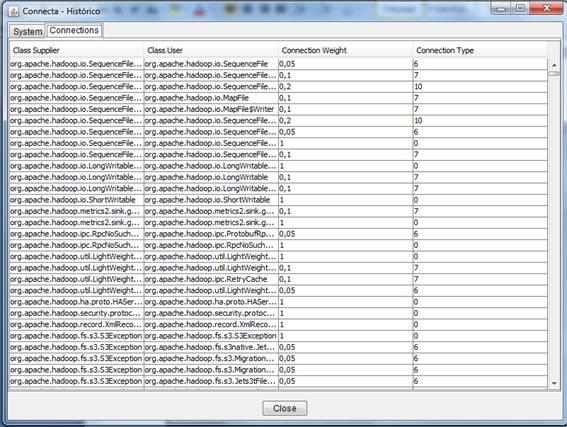
Selecting the Connections tab, you can view the metrics of connections, as shown below:
Query
and Viewing
The new query and visualization reproduces the results already collected by an analysis carried out through its .vis
file.
Click in Research -> Query and Viewing -> Select Files. Then select the file .vis and click Show result.

We can see that the screen is
displayed with all system metrics, which had been calculated previously, with this
you can analyze the data and view the Little House model,
without having to remake the analysis of the bytecode
of these classes.
Compare Versions
To compare versions it is necessary that
at some earlier time have already been made the
analysis of the two versions and
have their files .vis and .NET
stored.
Go to Tool -> Compare
Versions -> Select the first and second version files (file .NET and .vis ) in their respective places -> Show Results.


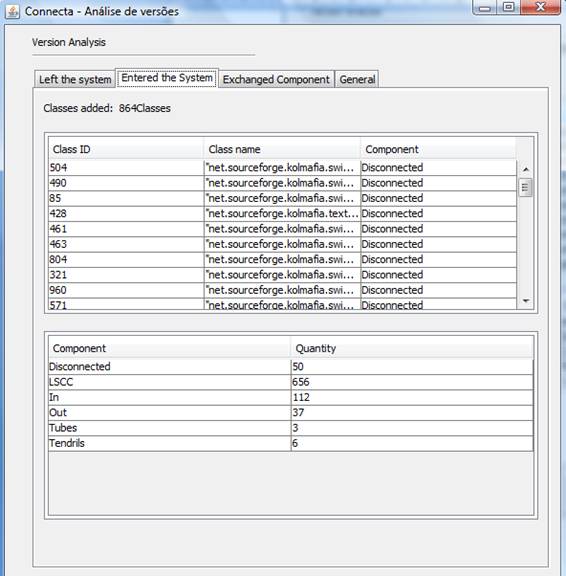
Connecta reports the data (name and component) of the classes
that was removed from or inserted in the system, by component.
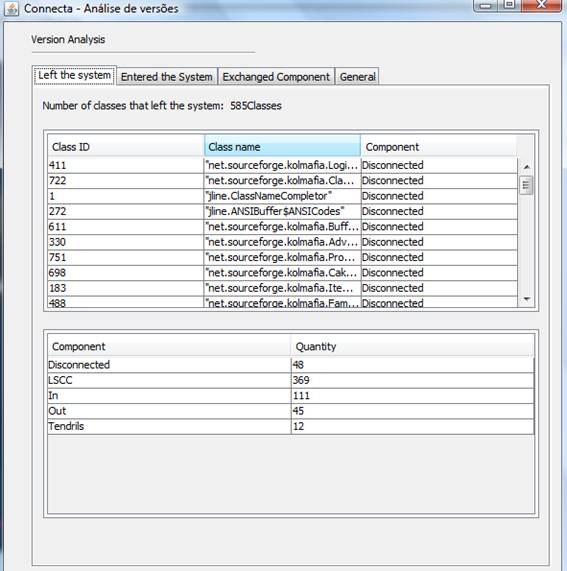
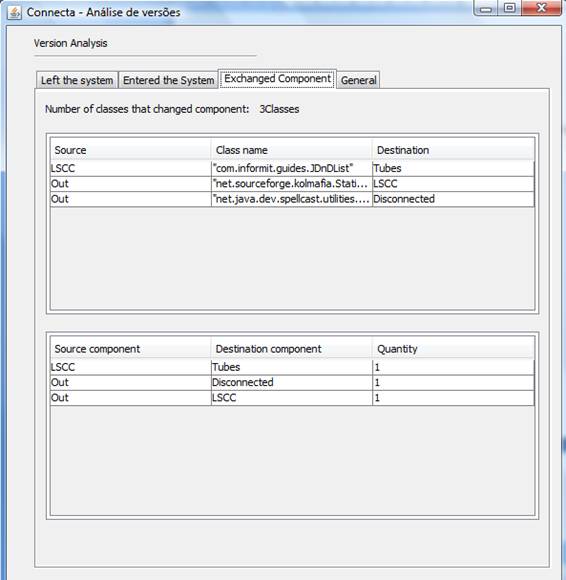
Connecta also reports the data of the classes that moved from
component.
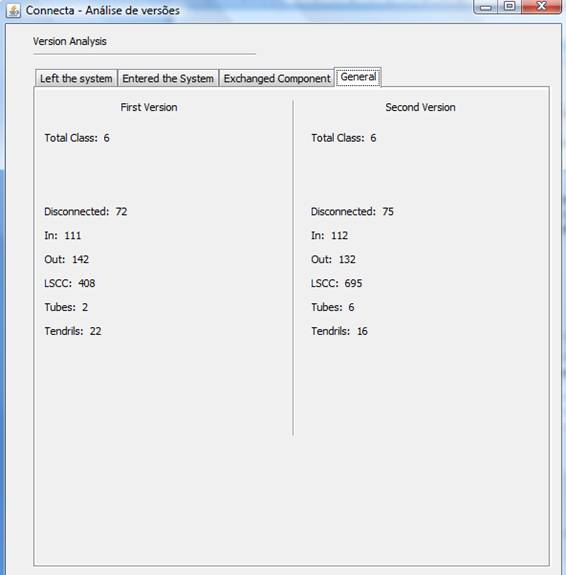
Connecta reports a summary of total classes, by each component, allowing
the numerical comparison of the Little House topology between the two versions.
After making the comparison between versions,
you can save this information by
clicking the ‘Save
to File’ button.
